In [1]:
import numpy
In [56]:
import matplotlib.pyplot as plt
%matplotlib inline
In [61]:
x = numpy.random.rand(100000)
In [79]:
def random_parameter():
    delta = (numpy.random.rand() - 0.5)*2
    alphabar = 2.5
    rp = 0.5/alphabar
    return alphabar*(1 + rp*delta)
In [80]:
omega = 0.5
In [82]:
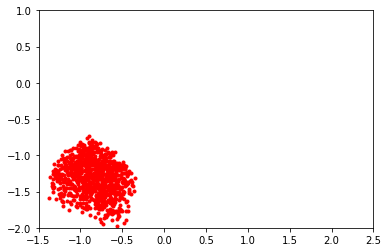
for i in range(1000):
    k = random_parameter()
    tau = random_parameter()
    theta = random_parameter()

    s = 1j*omega

    Gp = k/(tau*s + 1)*numpy.exp(-theta*s)
    plt.plot(Gp.real, Gp.imag, 'r.')
plt.xlim(-1.5, 2.5)
plt.ylim(-2, 1)
Out[82]:
(-2, 1)